AWS gives you CloudWatch. CloudWatch gives you metrics. But turning those metrics into a useful dashboard — with alerting, historical trends, and coverage across EC2, RDS, Lambda, ECS, ALB, and SQS — takes real work.
Most solutions cost too much. Others require agents on every server. Some need a dedicated team just to keep running. We wanted something simple and repeatable.
So we built it.
The Problem With CloudWatch Alone
Growing AWS environments generate observability data across dozens of services. Without the right tooling, that data sits in CloudWatch: visible, but not actionable.
You can see a CPU spike in the console. What you cannot see easily is the trend over the past 30 days, how it correlates with RDS latency that same hour, or whether it crossed a threshold that should have paged someone.
The gap is not data — CloudWatch has the data. The gap is the layer between raw metrics and operational insight: dashboards that persist, queries that correlate, alerts that route to the right place.
The question we were answering: how do you close that gap without a six-figure monitoring contract or a dedicated platform team?
The Architecture Decision
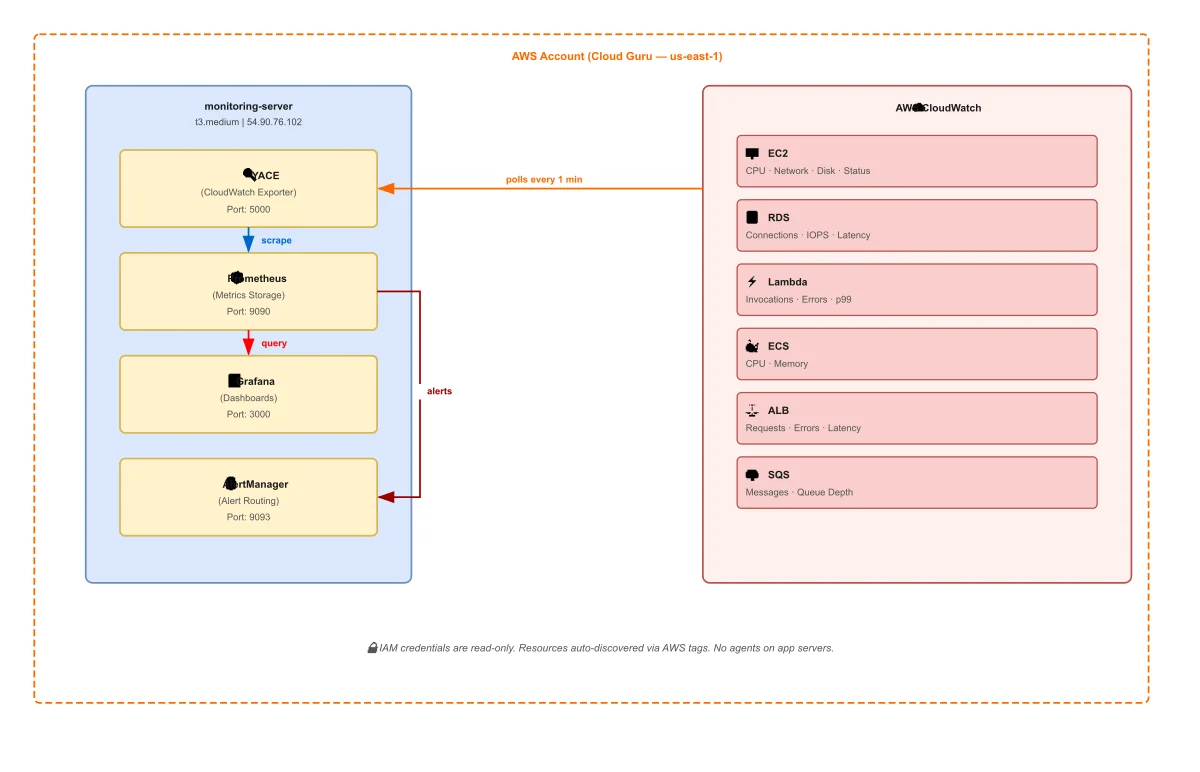
Four containers. One server. No agents on application servers.
| Service | Role |
|---|---|
| YACE | Polls CloudWatch, exposes metrics for scraping |
| Prometheus | Scrapes and stores time-series data |
| Grafana | Queries Prometheus, renders dashboards |
| AlertManager | Receives Prometheus alerts, routes notifications |
The key design choice is YACE — the Yet Another CloudWatch Exporter. Instead of deploying agents to every EC2 instance or application server, YACE sits on a single server and pulls metrics directly from the CloudWatch API. Your application servers stay untouched.
That server does not have to be on AWS. You can run this entire stack on a ZSoftly Cloud instance, a server in your local data center, or any machine with outbound internet access. YACE calls the CloudWatch API over HTTPS regardless of where it runs. The trade-off is cost: CloudWatch API calls are billed per request, and any metrics data leaving AWS counts as egress. For most environments those fees are small, but they are real and worth accounting for before you choose where to host the stack.
The second design choice is tag-based discovery. You do not maintain a list of instance IDs. YACE discovers resources automatically by querying your AWS account for tagged resources. A new EC2 instance, RDS database, or Lambda function shows up in Grafana the moment it exists in your account. Nothing to configure per resource.
In environments where infrastructure changes frequently, a monitoring system that requires manual registration per resource is a system that will always be partially out of date.
What It Covers
The stack monitors six AWS service categories with no additional configuration:
| Service | What Gets Tracked |
|---|---|
| EC2 | CPU, network, disk I/O, status checks |
| RDS | Connections, latency, IOPS, free storage |
| Lambda | Invocations, errors, duration (p99), throttles |
| ECS | CPU and memory utilization |
| ALB | Request count, response time, 4xx/5xx errors |
| SQS | Messages sent, received, visible, deleted |
That coverage handles the majority of what a typical AWS environment runs. Adding a new service means adding a YACE job. No new agents, no new servers.
The Security Model
The IAM user is read-only. YACE queries CloudWatch but cannot modify anything in AWS. You write credentials to the monitoring server with root-only file permissions and they never appear in version control.
For production, replace static credentials with an EC2 instance profile. The monitoring server assumes a role through the instance metadata service. No credentials on disk at all.
The principle is the same in both cases: the monitoring layer should have the minimum access it needs to read metrics and nothing more. Observability tooling with write access to your infrastructure is a risk that does not need to exist.
Why This Stack Works for Customer Conversations
We built this as a proof of concept that works in a single session. Given an AWS account, the full stack can be running against real production data in under five minutes.
It removes the abstract from the conversation. A live Grafana dashboard showing their own EC2 CPU trends and RDS latency changes the question. It goes from "what would this look like" to "here is what we would add for your environment."
No procurement, no long setup, and no vendor lock-in.
What Production Looks Like From Here
This stack is a starting point, not a finished product. Three things change when you move to production:
TLS in front of Grafana. The dashboard runs on port 3000 by default. For anything internet-facing, you add a reverse proxy with a valid certificate.
Remote storage for Prometheus. Local Prometheus storage works for short retention windows. For longer history — 90 days, 12 months — you route to a remote write backend. Thanos, Cortex, or a managed Prometheus service like Grafana Cloud.
Alerting receivers. AlertManager is wired up and ready. Adding a Slack webhook, PagerDuty integration, or email route is configuration, not code. The routing logic — group by severity, silence during maintenance windows, escalate after N minutes — is the part worth designing carefully for your environment.
The architecture stays the same. The operational maturity increases incrementally.
The Open Source Angle
Every component in this stack is open source. Prometheus, Grafana, AlertManager, and YACE are all Apache 2.0 or similar. There is no licensing cost, no usage-based pricing, and no vendor controlling your data.
The Ansible role that deploys this stack is open source in our aws-infra repository.
For AWS environments that are growing but not yet at the scale that justifies a managed observability platform contract, this architecture covers most use cases without the cost structure.
As a Canadian AWS Partner, ZSoftly helps businesses build production-grade observability for AWS environments across Toronto, Vancouver, Calgary, and Montreal. If you want this stack running against your AWS account, talk to us.